Flight Release Wizard
I redesigned a flight release workflow, replacing a fragmented five-system process with a single guided workspace that cut release time from 45 minutes to 17 and dropped the error rate from 8 percent to 2.

Timeframe
10 weeks
Users
Flight Dispatchers
Industry
Aviation
Type
Workflow Optimization
CHALLENGE
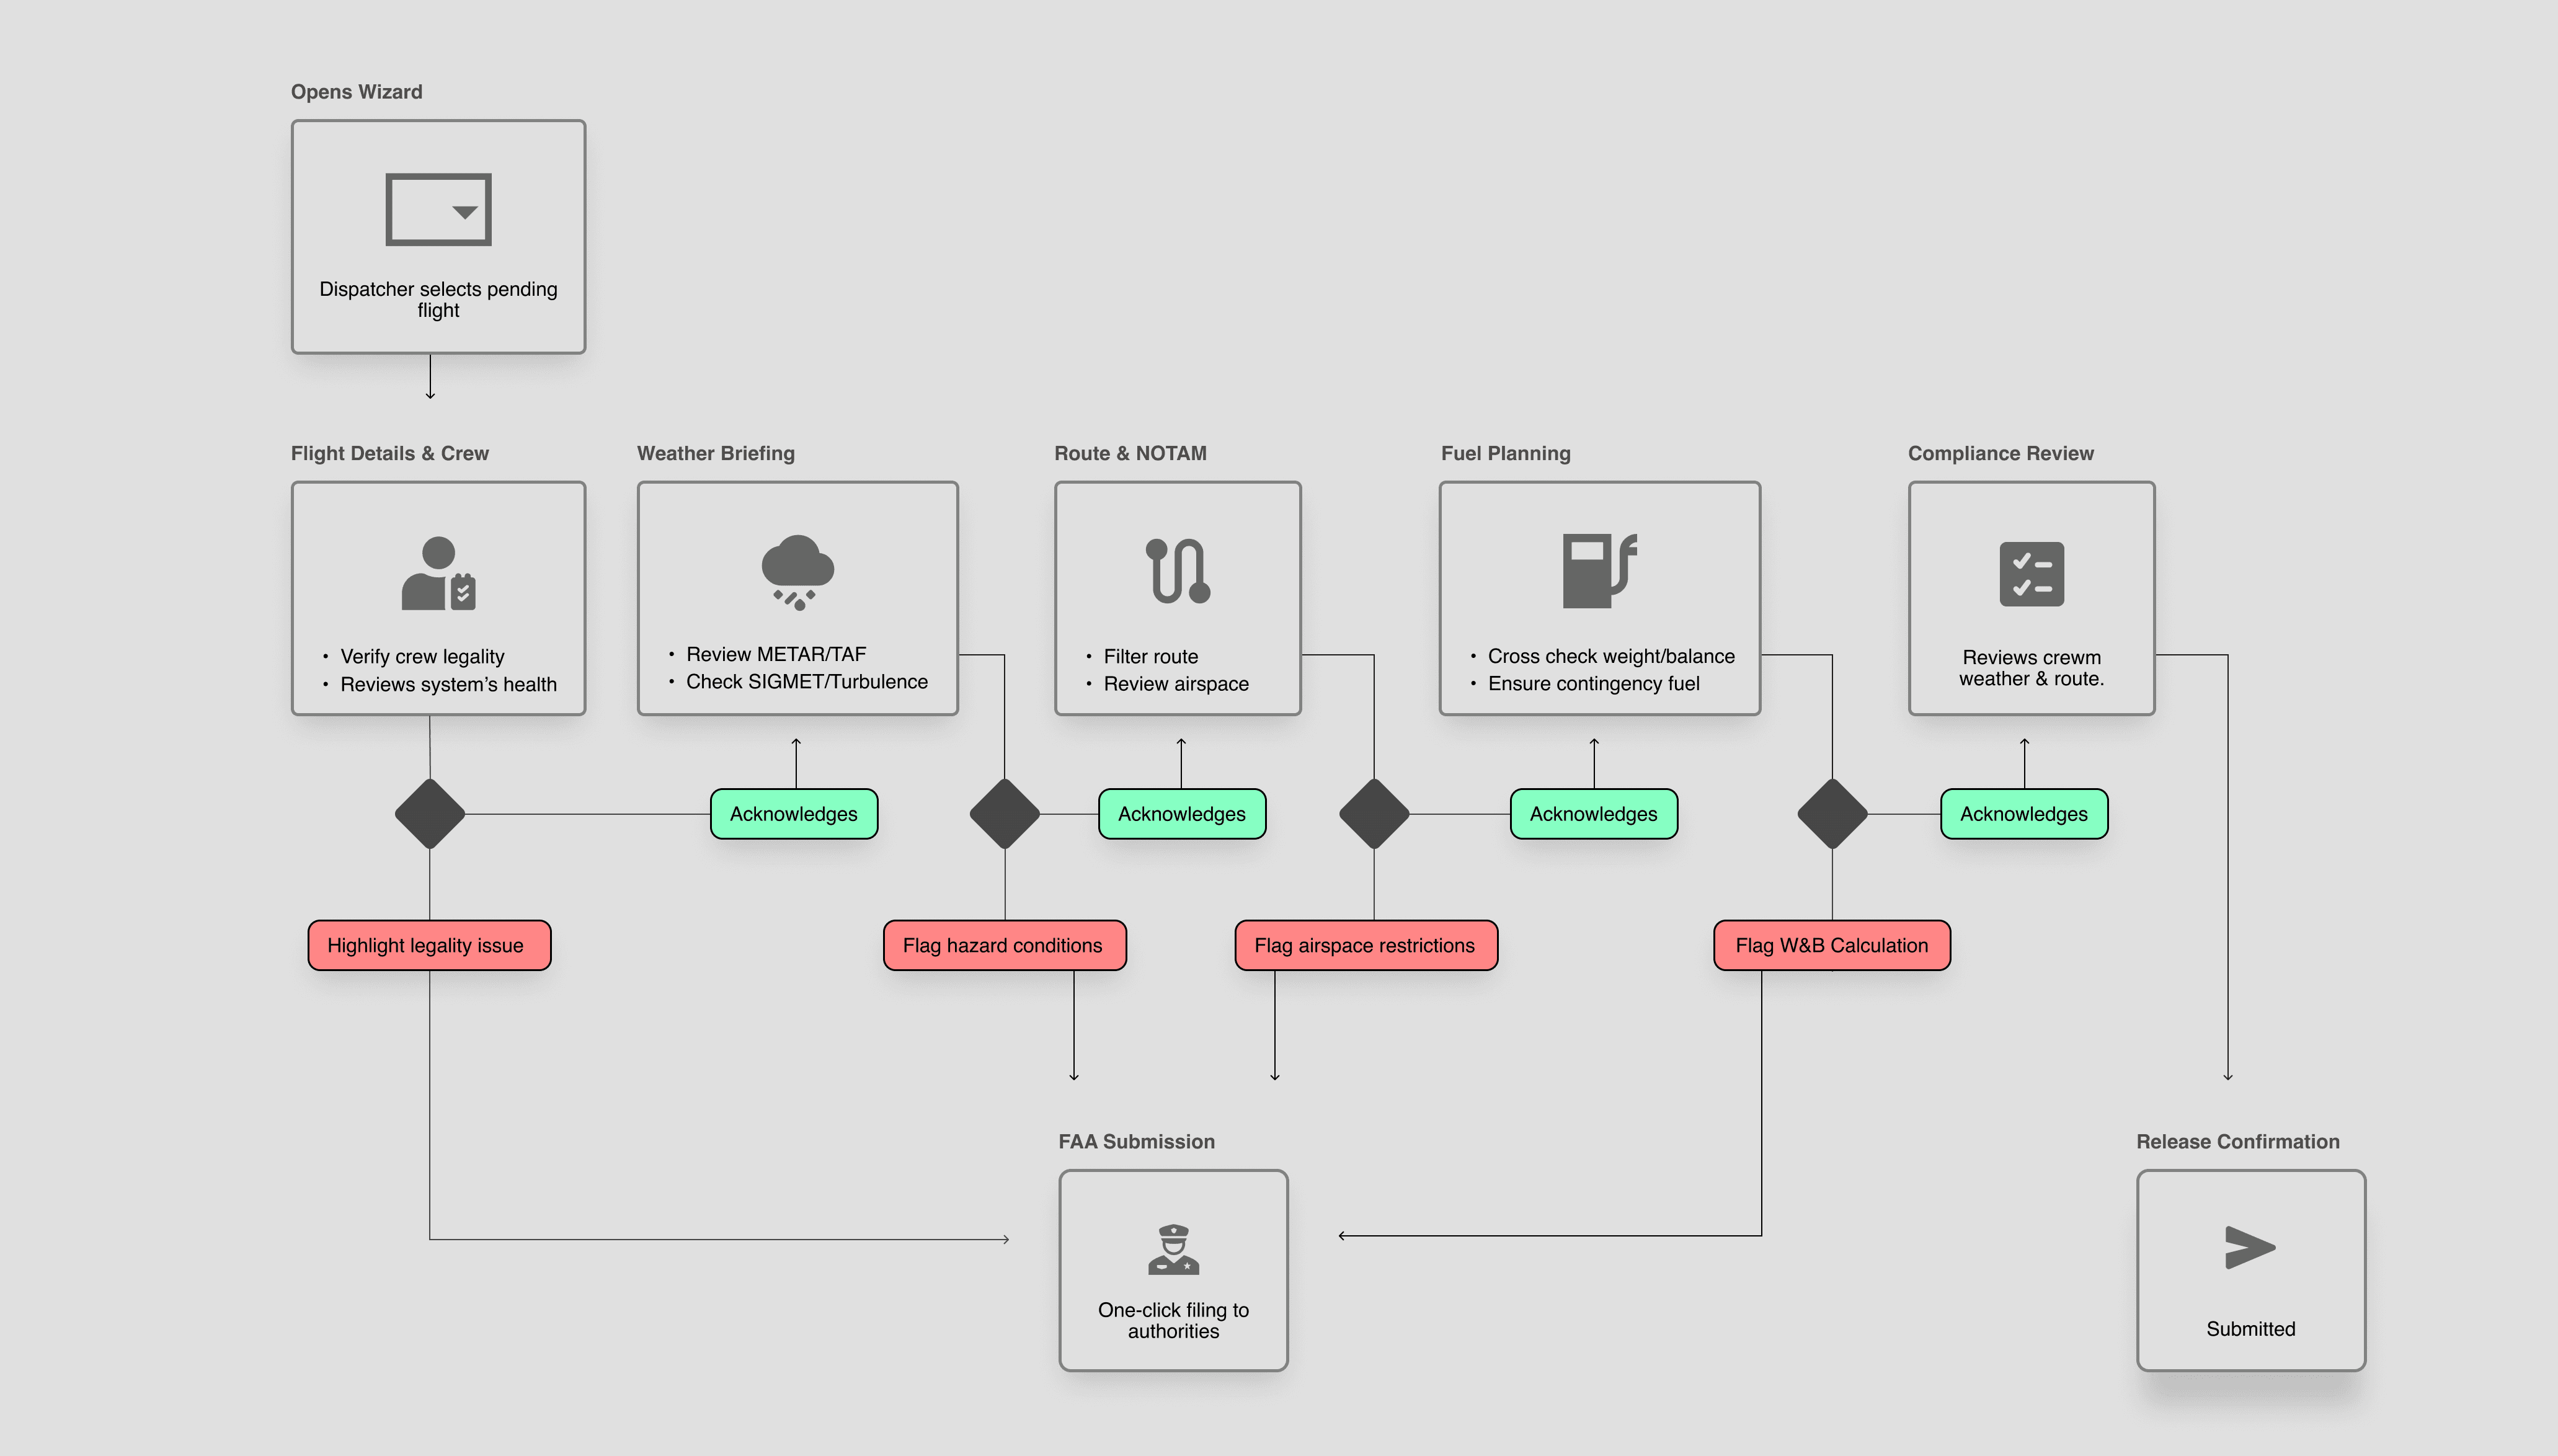
A flight release is a mandatory authorization procedure executed by dispatchers that verifies all safety and operational conditions before departure.
The problem was interdependence.
The airline's legacy flight release workflow required dispatchers to manually check data across five separate tools, none of which were designed to work together. Every release meant switching between systems, reconciling conflicting information, and reconstructing a complete operational picture by hand.
Post-COVID operating conditions increased pressure on an already fragile workflow. The airline began accumulating costly fines from regulatory violations because the tools made the job impossible to do reliably.
fewer submission
errors
faster release
cycles
automated validation
checks


RESULTS
Time-on-task dropped from 45 minutes to 17 minutes per release. Error rate fell from 8 percent to 2 percent. SUS score moved from 35 to 87.
HEART/GSM framing defined those success targets before design began, aligning measurement to task efficiency, error reduction, and dispatcher satisfaction.
Dispatchers reported higher confidence because release readiness was visible instead of assumed. Operations leadership gained a shared language for readiness, warnings, and blockers across the release workflow. The core wizard shipped intact across all five components. Deeper optimization features and broader analytics were deferred to keep the launch focused on release quality, compliance, and operator trust.
(from 8%)
(from 45 min)
(from 30)
APPROACH
The most important finding from workflow analysis was the structural pattern underneath them
Context switching across five systems was the primary driver of both delay and error, and no improvement to any single system could address it.
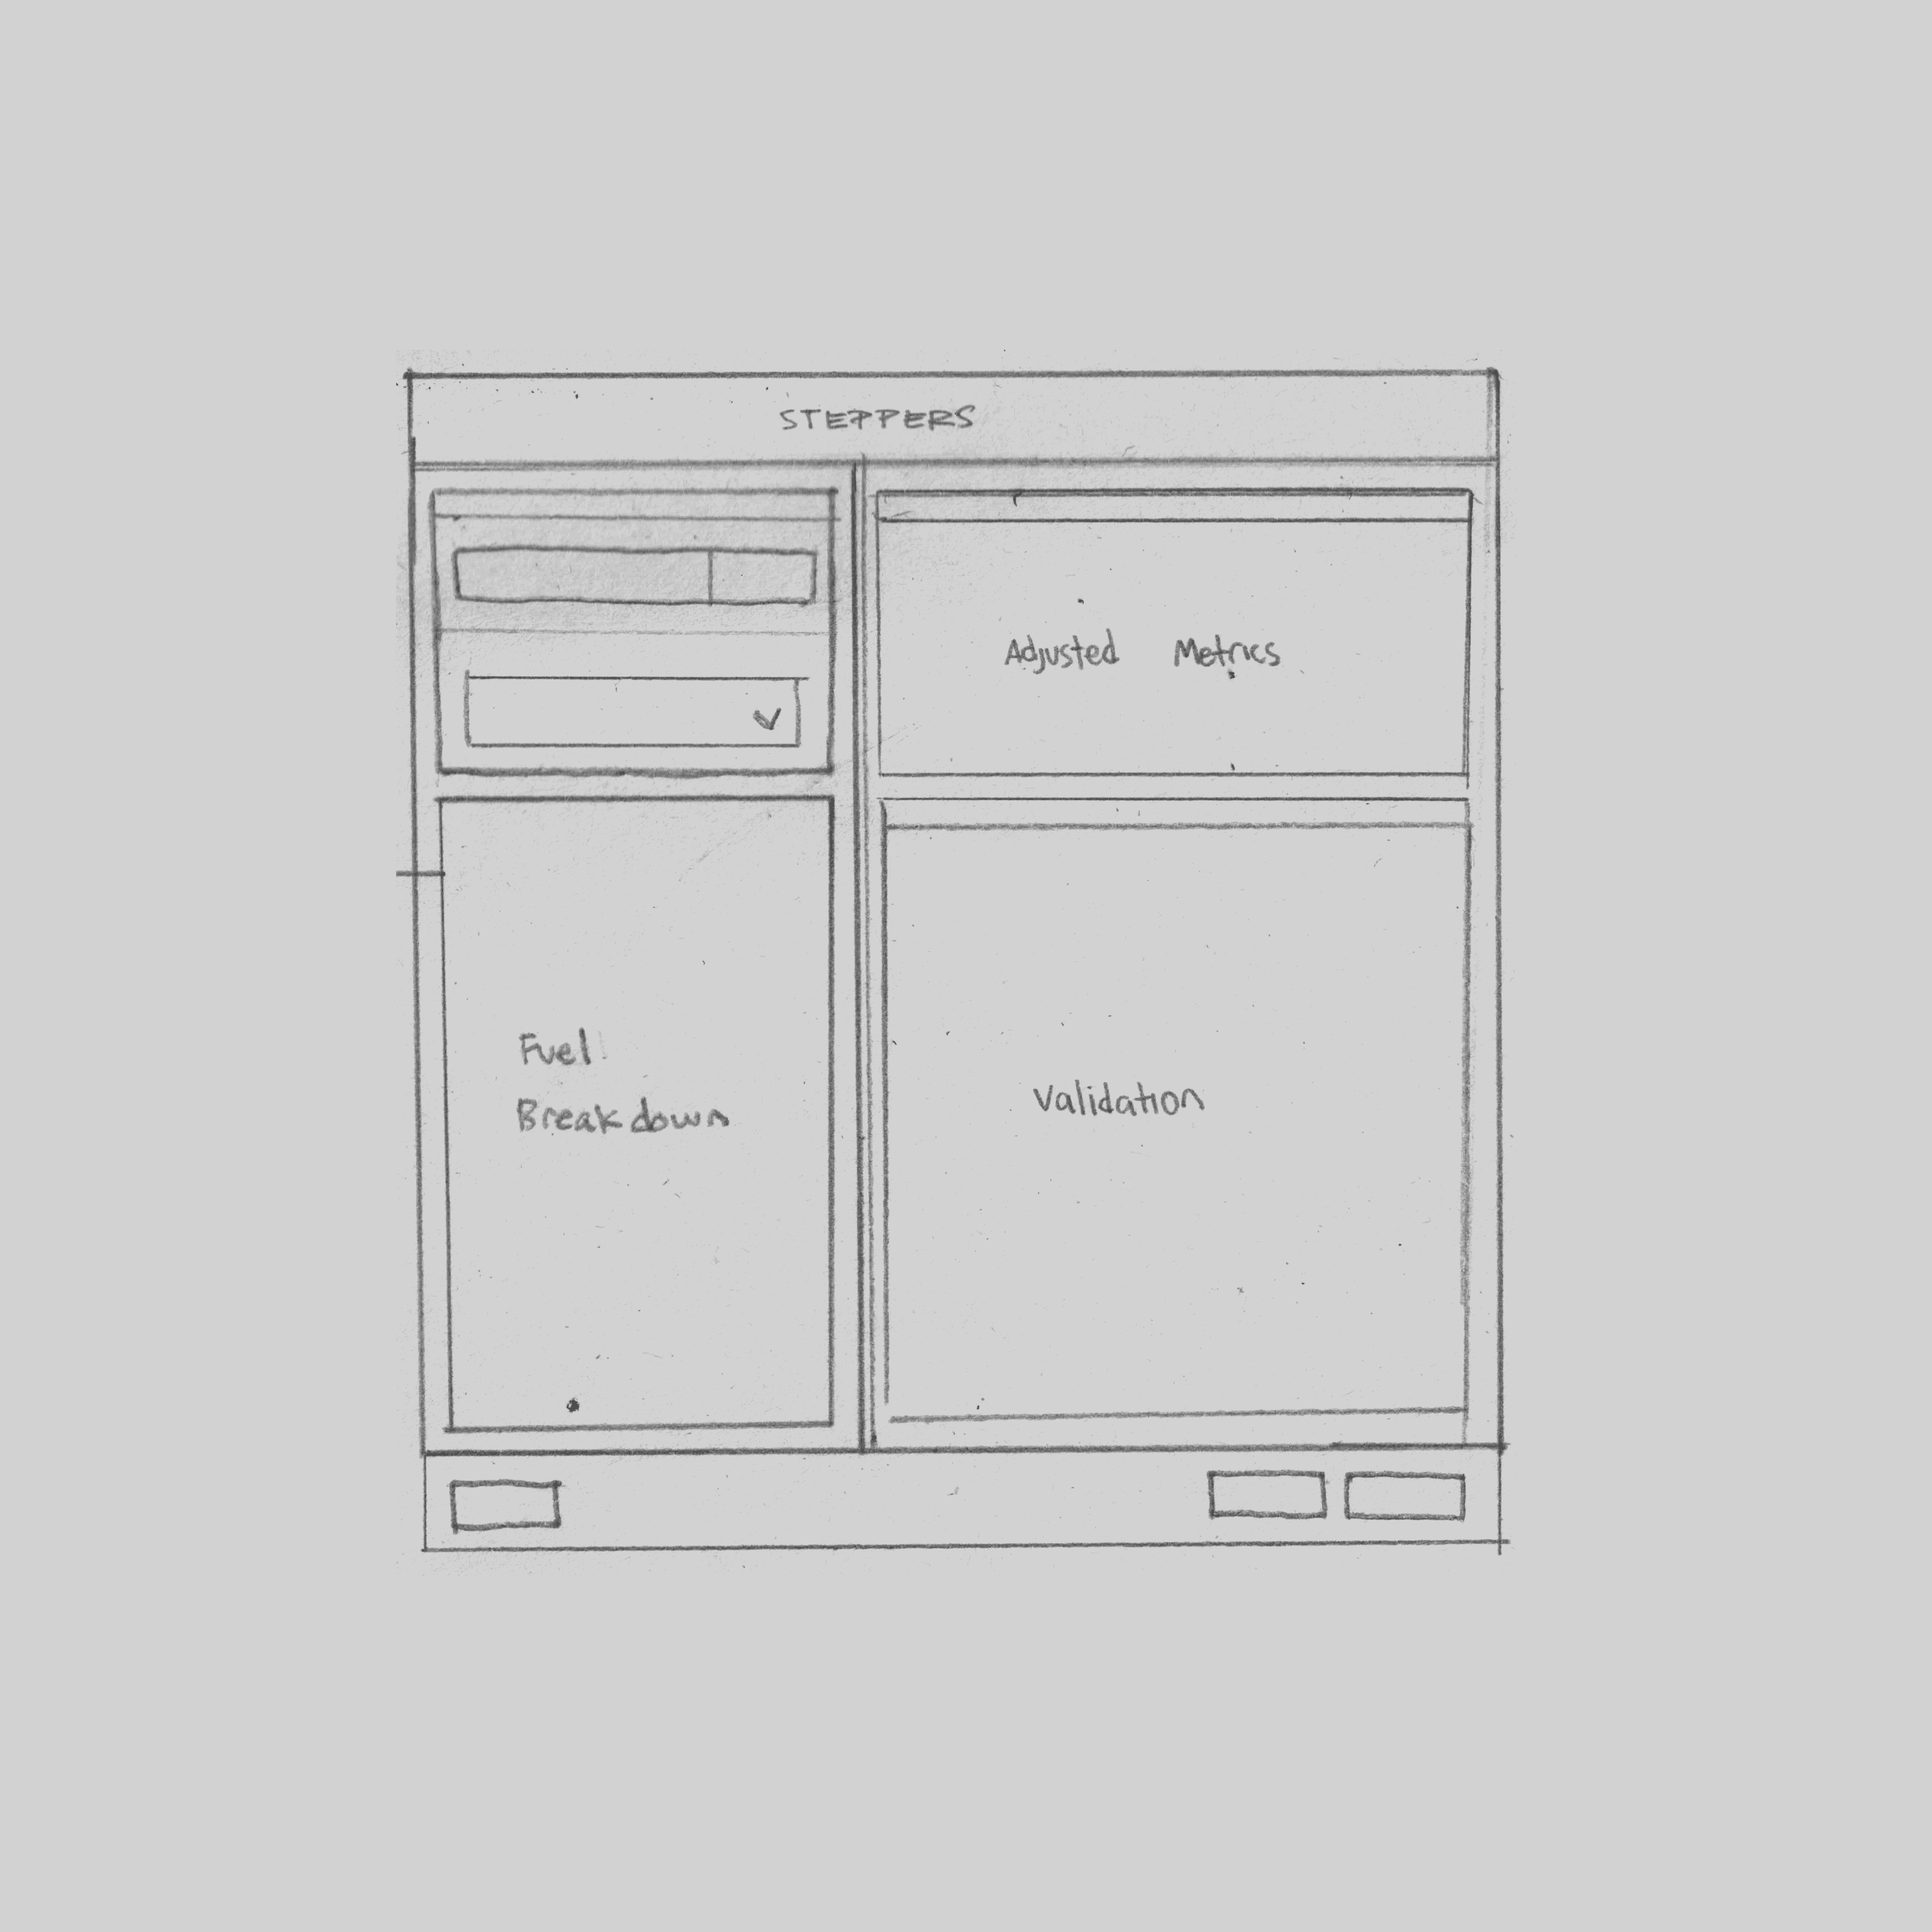
That insight shifted the design direction from screen-level optimization to workflow architecture. What dispatchers needed was not a better tool for each step. It was a single environment where each step's dependencies were already resolved.
I used workflow analysis and contextual review to map how releases were performed under time pressure, not how they were documented.
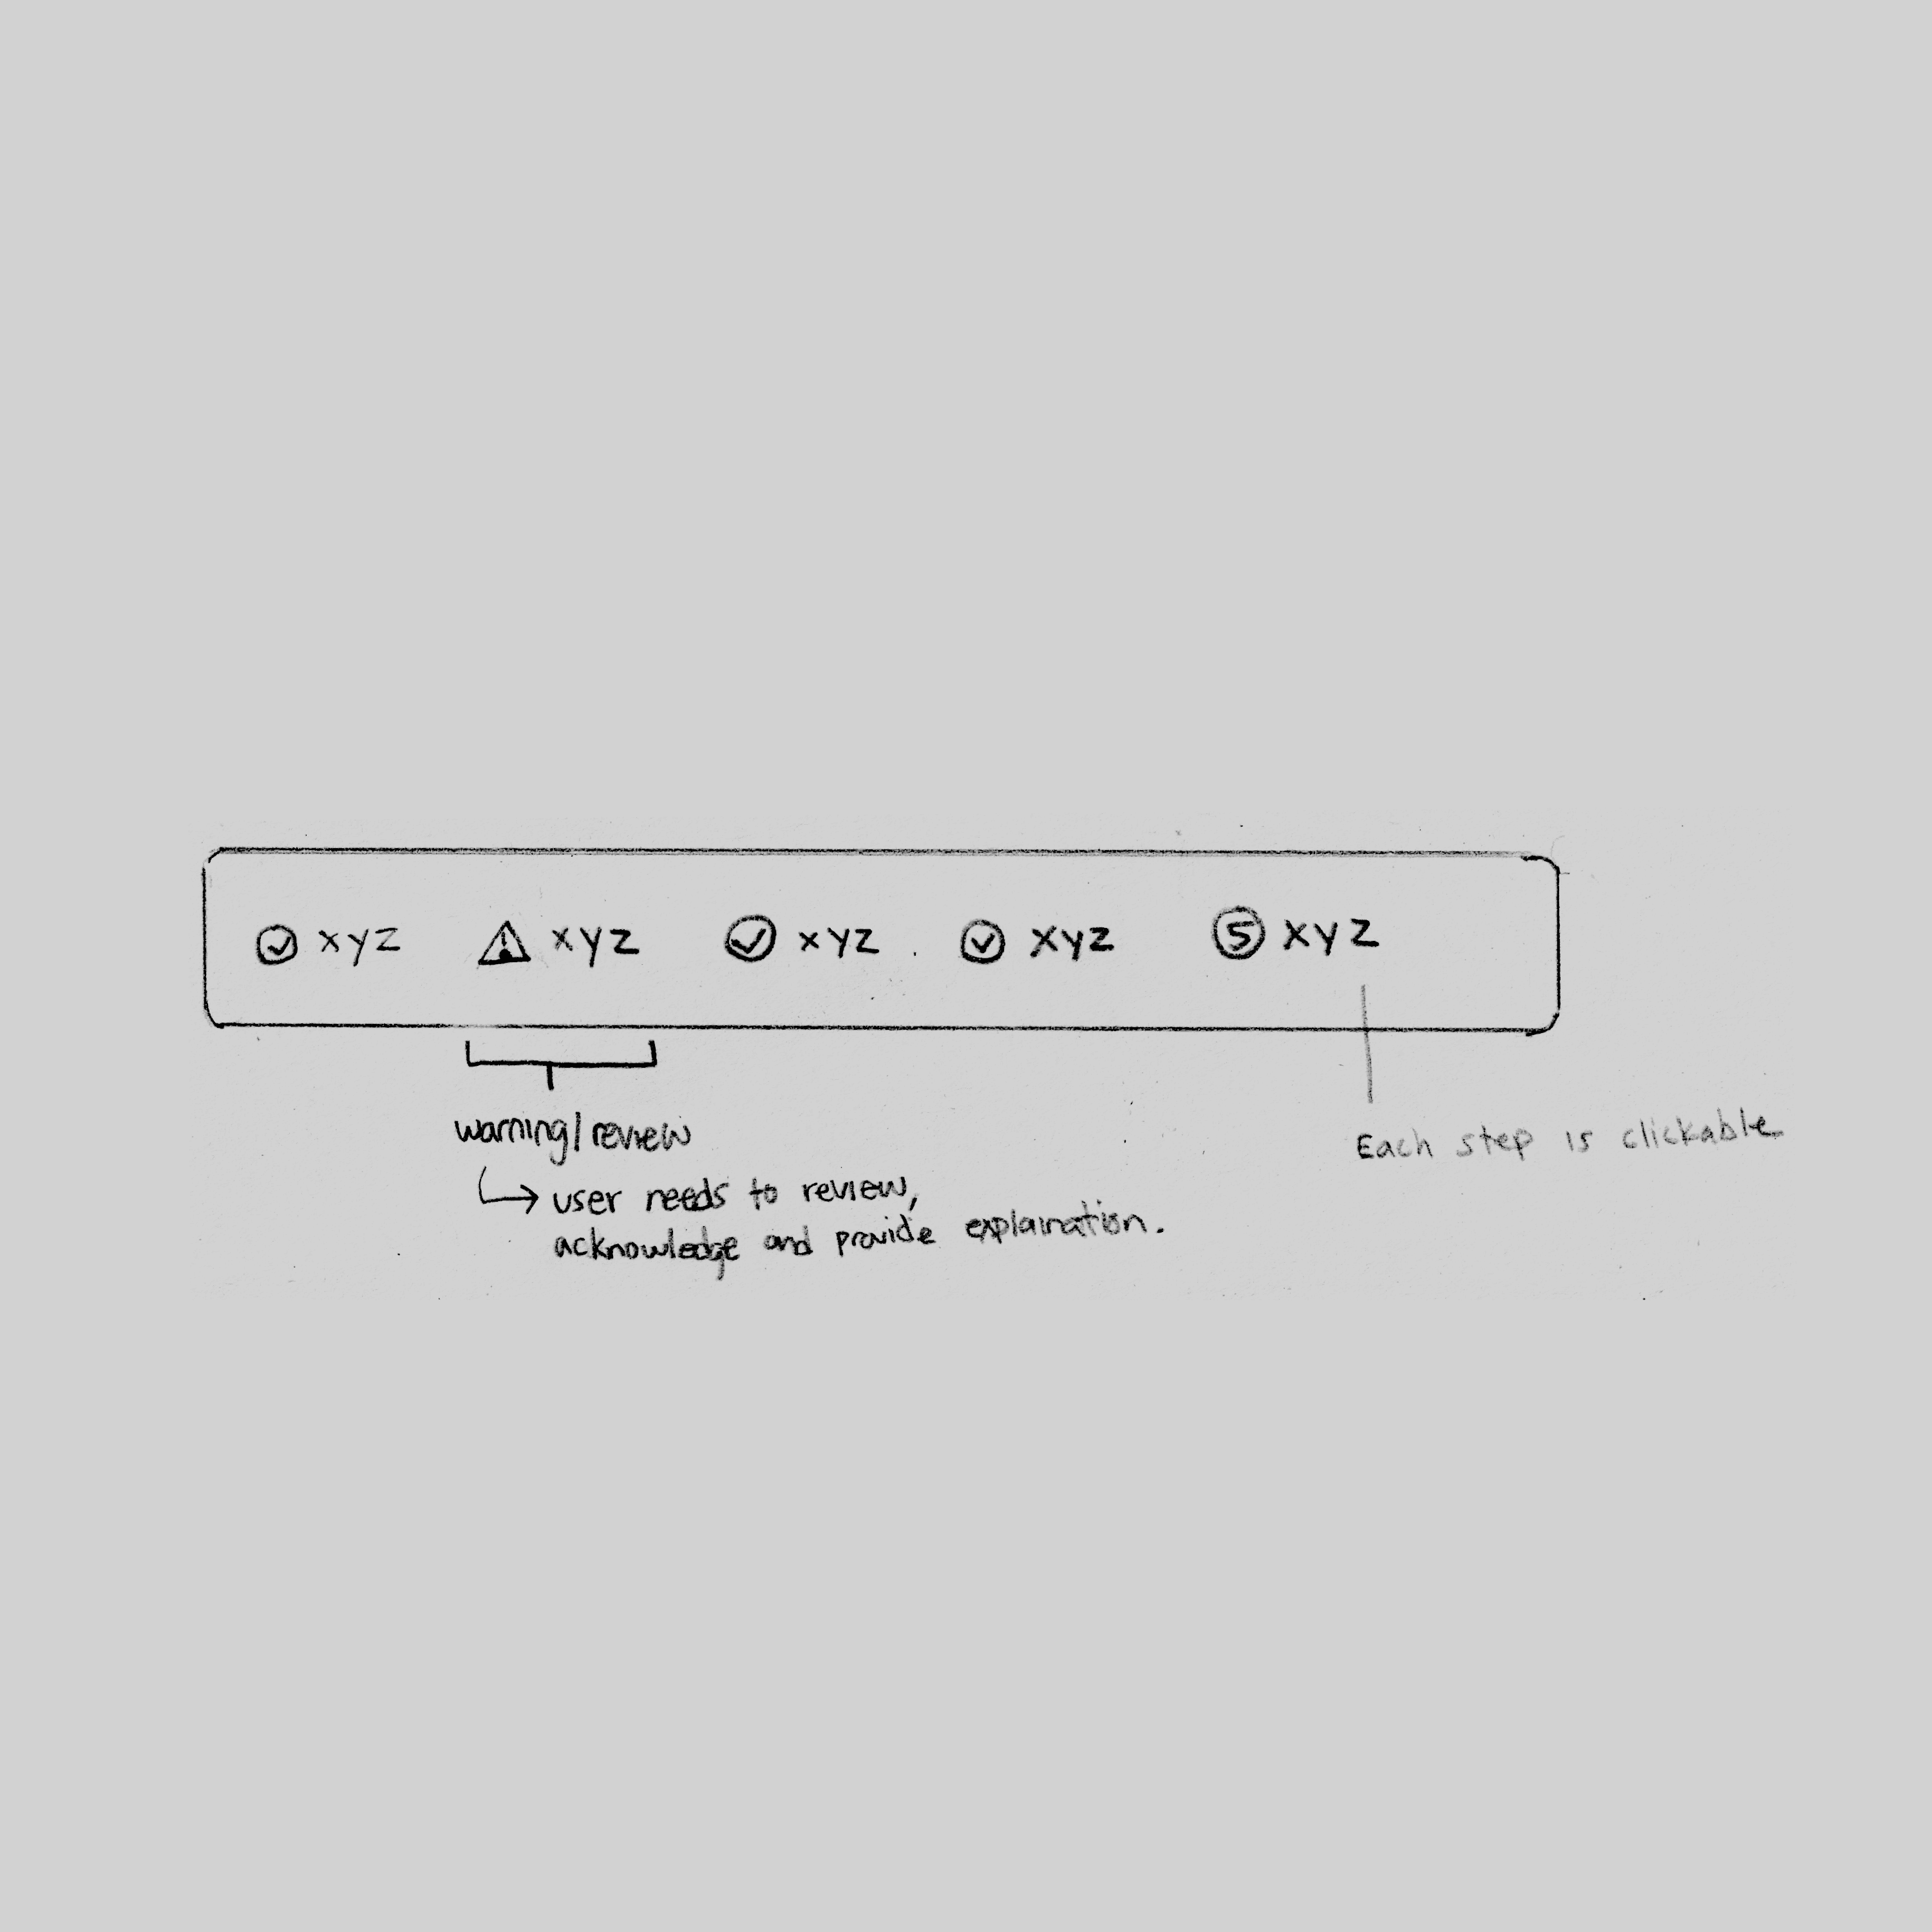
HEART/GSM defined measurable success criteria anchored to compliance and task performance. Progressive validation turned release readiness into visible, structured state at each step.
Human-in-the-loop decision design shaped how AI evidence was surfaced during route evaluation, scoping the system's role carefully against the dispatcher's retained authority.


Let's Talk
The deeper decisions around HEART/GSM alignment in a compliance-driven workflow, AI authority framing in a safety-critical environment, deliberate override design in gated submission, and the workflow architecture required to consolidate five systems into one coherent workspace are better covered in conversation.
